Using Trace Tools
You can use the following tools to gain insight into the requests and responses passing between a Centrify client application and the server:
- Fiddler is a free application that displays detailed information about network traffic between your computer and the Internet. You can use it to analyze the REST requests and responses that occur between a Centrify application running on your computer and your Centrify tenant. Installing and configuring Fiddler on Windows is less complex than on OS X.
- The Chrome browser has a similar built-in developer toolset you can use to view requests and responses. To use it, you must run your Centrify client in the Chrome browser.
Tools such as these enable you to see the raw messages being exchanged, so these tools are useful for debugging client applications that you build using the Centrify REST API. You can save this information discuss it with other developers, to get help from Centrify Support, and to perform in-depth analysis of a web session.
This article provides a brief introduction to these tools including information about setting them up and a brief tutorial on using them to analyze traffic between your browser-based Centrify tenant and the Centrify server.
Fiddler
Learning Fiddler’s User Interface
The following screenshot highlights the main elements of Fiddler’s GUI:
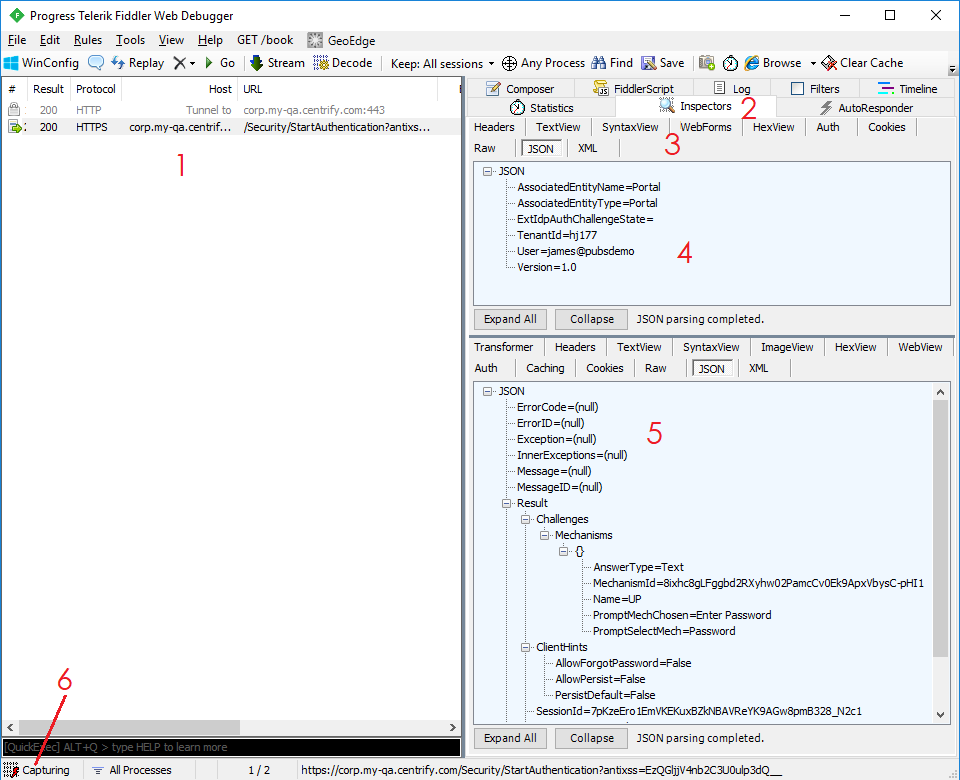
- Network traffic events: Lists the network traffic events that have occurred on your machine, including important details such as the HOST and URL. You can click each event to obtain more information. You can sort events by clicking the column headings. The URL column is important because you can use it to identify endpoint calls quickly.
- Inspectors tab: Displays information about the request for the selected network traffic event.
- Element and format tabs: Specify the element of the request to show. Click Headers to display header information or click JSON to display the body of the request in an interactive tree view.
- Request window: Displays the contents of the currently selected request element.
- Response window: Displays the contents of the response. Click JSON to display the JSON response in an interactive tree view.
- Capture toggle panel: Toggles traffic capture on or off. When capture is off, no icon or text is displayed in this panel, and Fiddler ignores all network traffic. Turning off capture is useful when debugging a specific event because Fiddler captures traffic from all processes on your computer by default. All this traffic can quickly flood the network event list, making it difficult to locate the event of interest.
Setting up your Environment
Fiddler for Windows is highly recommended because of its ease of installation. If you’re using a Mac, another tool like Chrome’s built-in developer toolset is preferable.
Fiddler can analyze traffic from all web browsers. Some browsers may present proxy and security setup issues and may require additional set up.
Setting up Decryption and TLS 1.2
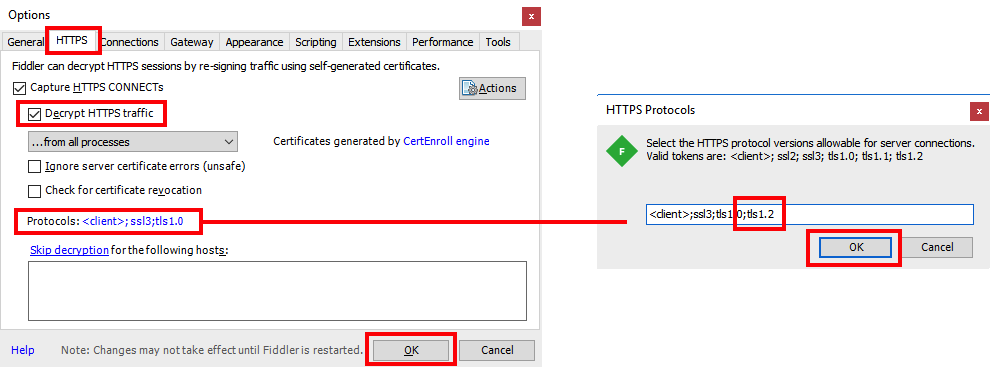
To view all of the Centrify REST requests and responses in Fiddler, you must enable decryption and TLS 1.2 in Fiddler’s settings:
- Navigate to Tools > Options.
- Select the HTTPS tab.
- Enable the Decrypt HTTPS traffic checkbox.
- Click the list of protocols to the right of the Protocols item, add
;tls1.2to the list in the popup, and click OK to close the popup. - Click OK.
- Click OK or Yes on all warning dialogs that appear regarding security and certificates.
Note: After you select Decrypt, Google searches might fail to work. If you need to perform a Google search while debugging, temporarily cancel the selection of Decrypt.
Setting up TLS 1.2 support
The Centrify API requires the use of TLS 1.2 or greater. As such Fiddler must have TLS 1.2 enabled:
- Navigate to Tools > Options.
- Select the HTTPS tab.
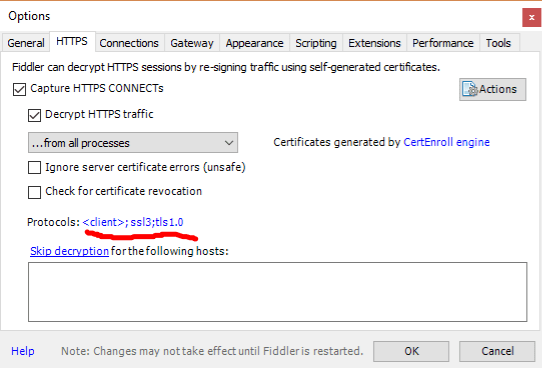
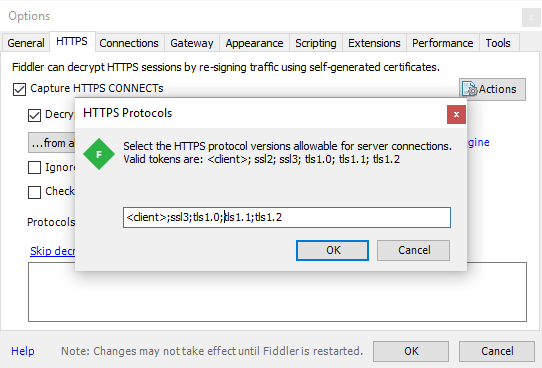
- Click on the blue protocols link
- Add "tls1.2" to the end of the list making sure to keep each entry separated with semi-colons.
- Click OK.
- Click OK or Yes on all warning dialogs that appear regarding security and certificates.
Setting up an Optimal Window Layout
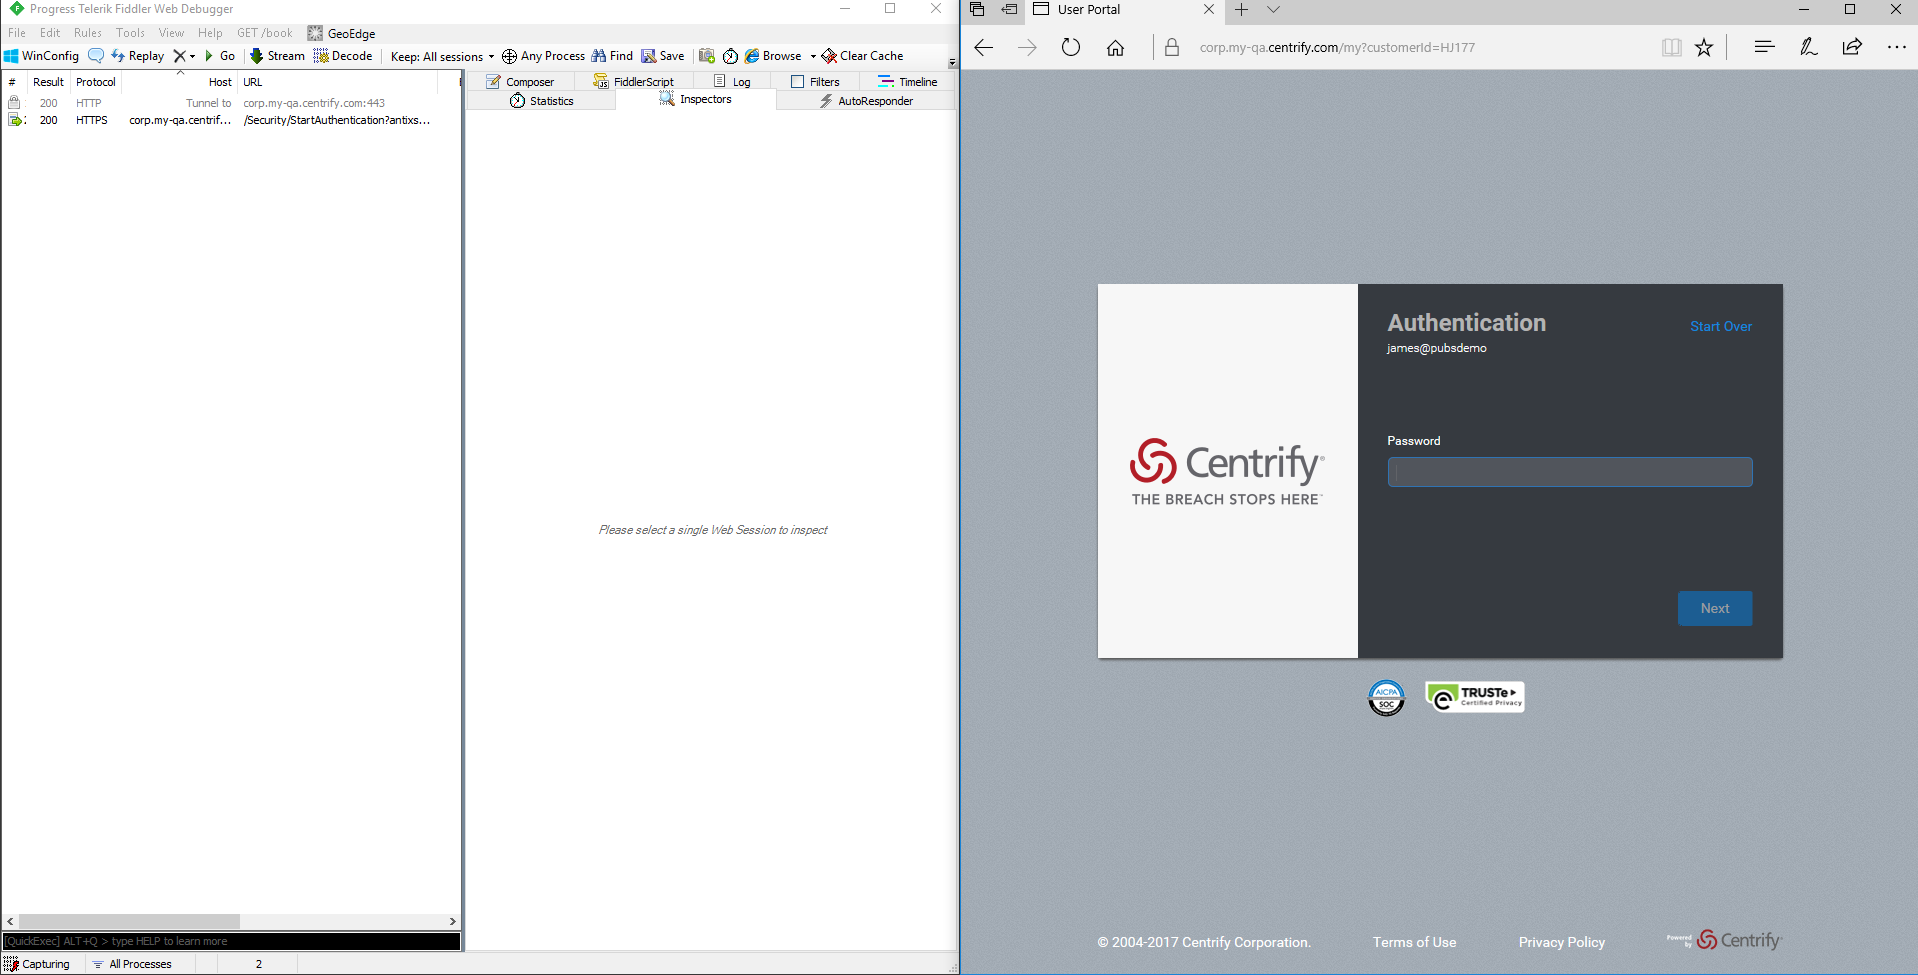
When you analyze network requests, you must frequently navigate between the Fiddler window and your client application (browser) window to correlate client actions with network traffic events. For that reason, the optimal layout is to place your windows side by side, as shown here:
Filtering Network Traffic Events
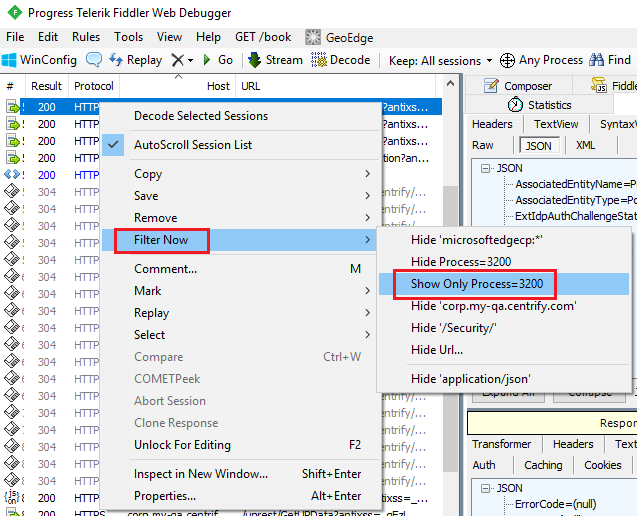
Initially, Fiddler displays network traffic events from all processes running on your computer. If you want to see only events related to your Centrify application, you must filter the events. You cannot begin filtering until after the client application has invoked its first Centrify endpoint (for example, /Security/StartAuthentication) so that you can tell Fiddler which process to filter on.
To filter on a network event:
- Ensure that your first endpoint has been invoked and is shown in the network event list.
- Right-click a network event related to your Centrify application.
- Select Filter Now > Show Only Process=<process_number>.
This tells Fiddler to only show events from your client process.
Clearing Network Traffic Events
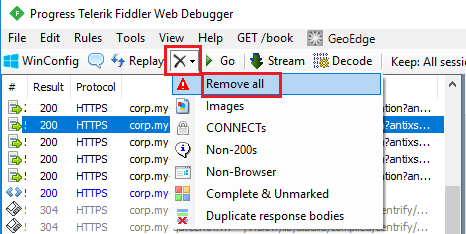
You might find it useful to clear the list of network traffic events after you have analyzed them or after Fiddler has generated a large list of events from other applications.
To clear network traffic events, click X and select Remove all from the list.
Exporting Session Data
Fiddler allows you to save the network event information from your session so that you or someone else can examine it at a later point. You can save information either as a text file or as a Fiddler file that can be opened in Fiddler.
To save network event traffic as a text file:
- Select File > Export Sessions > Selected Sessions to save the currently selected network event.
- Select File > Export Sessions > ALL Sessions to save all network events. This method is preferred by Centrify because Centrify requires a full trace when analyzing network events.
- Select the type of export output from the menu on the Select Export Format dialog.
- For example, select Raw Files to save as a text file.
- Click Next.
- Enter the path or click Browse to select a location.
- Click Export >>> to export the network data.
To save network event traffic as a Fiddler file:
- Select File > Save Selected Sessions > in ArchiveZip to save the currently selected network event.
- Select File > Save > All Sessions to save all network events. This method is preferred by Centrify because Centrify requires a full trace when analyzing network events.
- Select a location, enter a filename, and click Save. A
.sazfile is generated. - To open the file, click File > Load Archive, select the file, and click Open.
Analyzing the Centrify Authentication Endpoints
/Security/StartAuthentication is the first Centrify endpoint that a client application invokes because that endpoint starts the authentication process for a given user and returns any additional challenges to which the user must respond for successful authentication. This section shows how to analyze the /Security/StartAuthentication request and response.
To analyze /Security/StartAuthentication in Fiddler:
- Enter your cloud tenant URL in a browser.
- Enter your user name and click Next.
- Navigate to the network event list in Fiddler and click
/security/StartAuthentication. - (Optional) Filter the network events so that only Fiddler events are shown: Right-click the network event and select Filter Now > Show Only Process=<process_number>.
- Ensure that the Inspectors tab is selected.
- Click Headers to view the header information of the
/security/StartAuthenticationrequest. - Click JSON to view the elements of the request body. Here you can verify that the required parameters for the
/Security/StartAuthenticationendpoint (TenantId,User, andVersion) are present and correct. - Click JSON in the response view to see the elements of the response body.
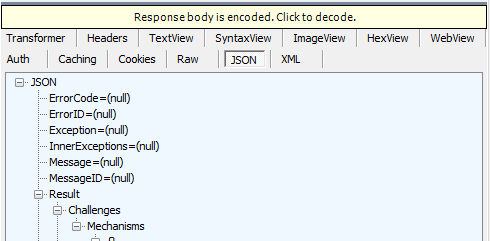
Note: Fiddler may indicate that some part of the request or response is encoded. Click on that message when it occurs to complete the decoding:
- Verify that the value of the
successfield in the response is set toTrueand note theMechanismIdandSessionId. These will be used below when the client invokes /Security/AdvanceAuthentication as described next.
/Security/AdvanceAuthentication is the next Centrify endpoint that a client application invokes after /Security/StartAuthentication because /Security/AdvanceAuthentication sends the user’s response to the challenges back to Centrify for verification.
To analyze /Security/AdvanceAuthentication in Fiddler:
- Ensure that you’re on the password entry screen.
- Enter your password and click Next.
- Navigate to the network event list in Fiddler and click the
/Security/AdvanceAuthenticationURL. - Ensure that the Inspectors tab is selected.
- Click Headers to view the header information of the
/Security/StartAuthenticationrequest. - Click JSON to view the elements of the request body. Note that the
SessionIdandMechanismIdmatch those in the response from/Security/AdvanceAuthentication. - Click JSON in the response view to see the elements of the response body.
- Verify that the value of the
successfield in the response is set toTrueand examine the fields in theResultelement, most notably theAuthfield. This is the authentication token that the client application includes in subsequent API calls to tell Centrify that the client application is invoking a call on behalf of an authenticated user. See the Authentication tutorial for more information about using the token for subsequent API calls.
Analyzing an Additional API Call
After you successfully authenticate the user with /Security/StartAuthentication, /Security/AdvanceAuthentication, you have an authentication token that you can use to invoke other endpoints of the Centrify REST API. Analyze subsequent API calls in Fiddler in the same way as described in the previous two sections.
The example used in this article includes authentication of your cloud tenant. After this authentication, the user is automatically redirected to a list of the user’s applications. The /UPRest/GetUPData endpoint was automatically invoked to obtain this list. Therefore, the network event list not only shows the response from /Security/AdvanceAuthentication but also that of the /uprest/GetUPData endpoint and other communications between the client and server.
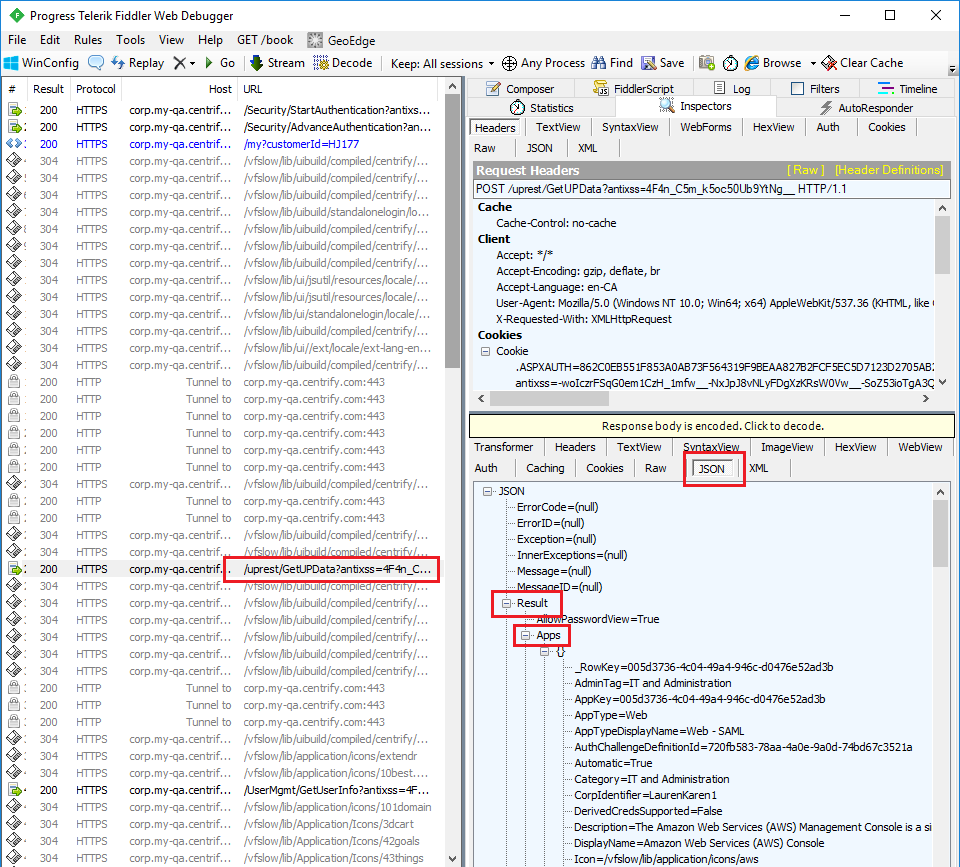
To analyze /uprest/GetUPData in Fiddler:
- Locate and select the
/uprest/GetUPDatanetwork event. - Click JSON in the response window.
- Expand the JSON tree so that the Result > Apps field is expanded, and then expand each element of the Apps collection. The elements in this list correspond to the applications available to the user, which are displayed in the browser.
Chrome Developer Toolset
Setting up your Environment
Setting up an Optimal Window Layout
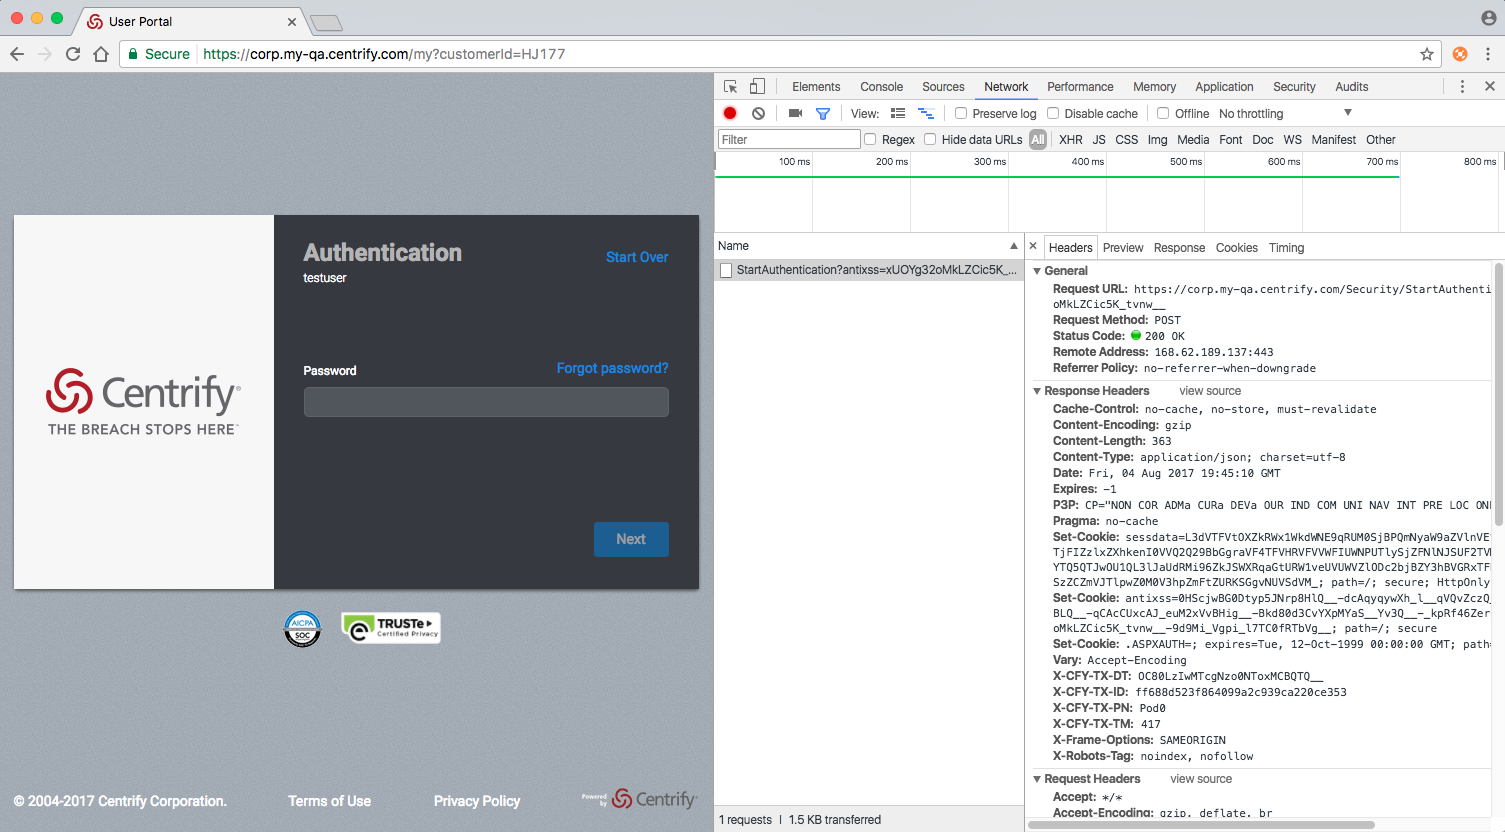
When you analyze network requests, you must frequently navigate between Chrome’s developer pane and your client application (browser) view to correlate client actions with network traffic events. For that reason, the optimal layout is to place these windows side by side, as shown below.
When you use Chrome’s built-in developer tools, Chrome displays the toolset either on the right or bottom of the screen, depending on how you have configured it. For best results:
- Maximize the browser to consume the whole screen
- Resize the browser’s client application and developer tool panes by dragging the border between them so that each side provides sufficient levels of detail.
This configuration is shown below:
Analyzing the Centrify Authentication Endpoints
/Security/StartAuthentication is the first Centrify endpoint that a client application invokes because that endpoint starts the authentication process for a given user and returns any additional challenges to which the user must respond for successful authentication. This section shows how to analyze the /Security/StartAuthentication request and response.
To analyze /Security/StartAuthentication using Chrome’s built-in developer toolset:
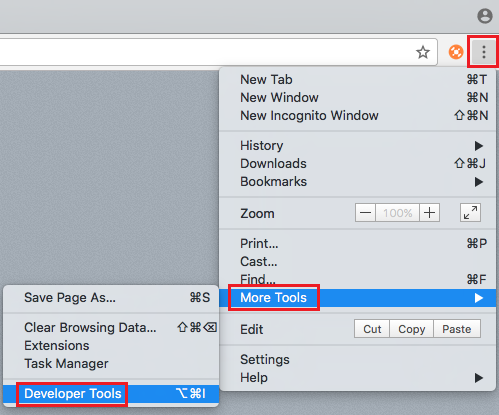
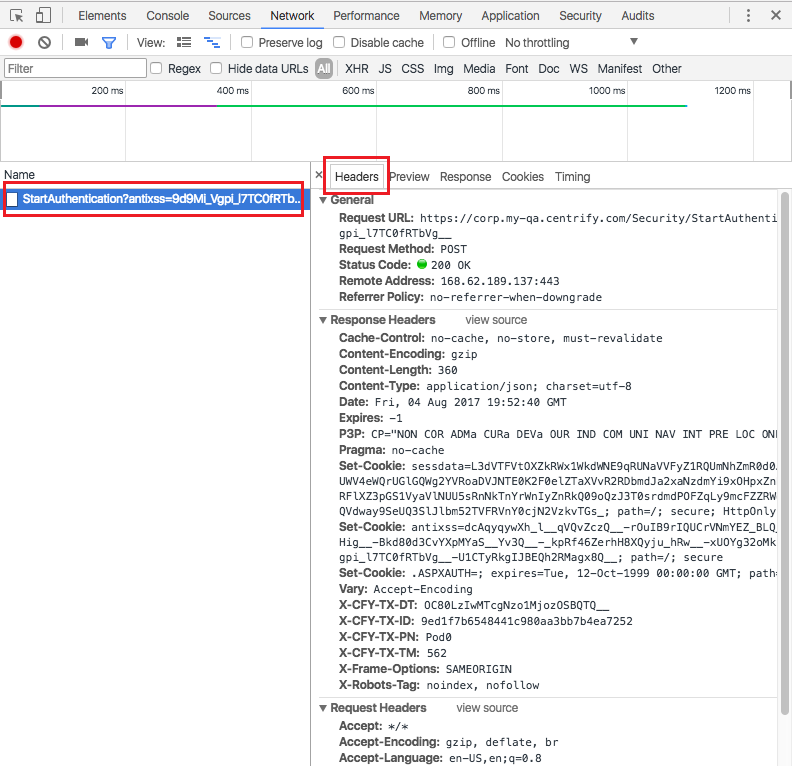
- Click on the button with three vertical dots in the upper right-hand corner of Chrome and select More Tools > Developer Tools to display the developer tools window.
- Enter your cloud tenant URL into Chrome.
- Enter your username and click Next. A
StartAuthenticationshould appear in the developer tools window.
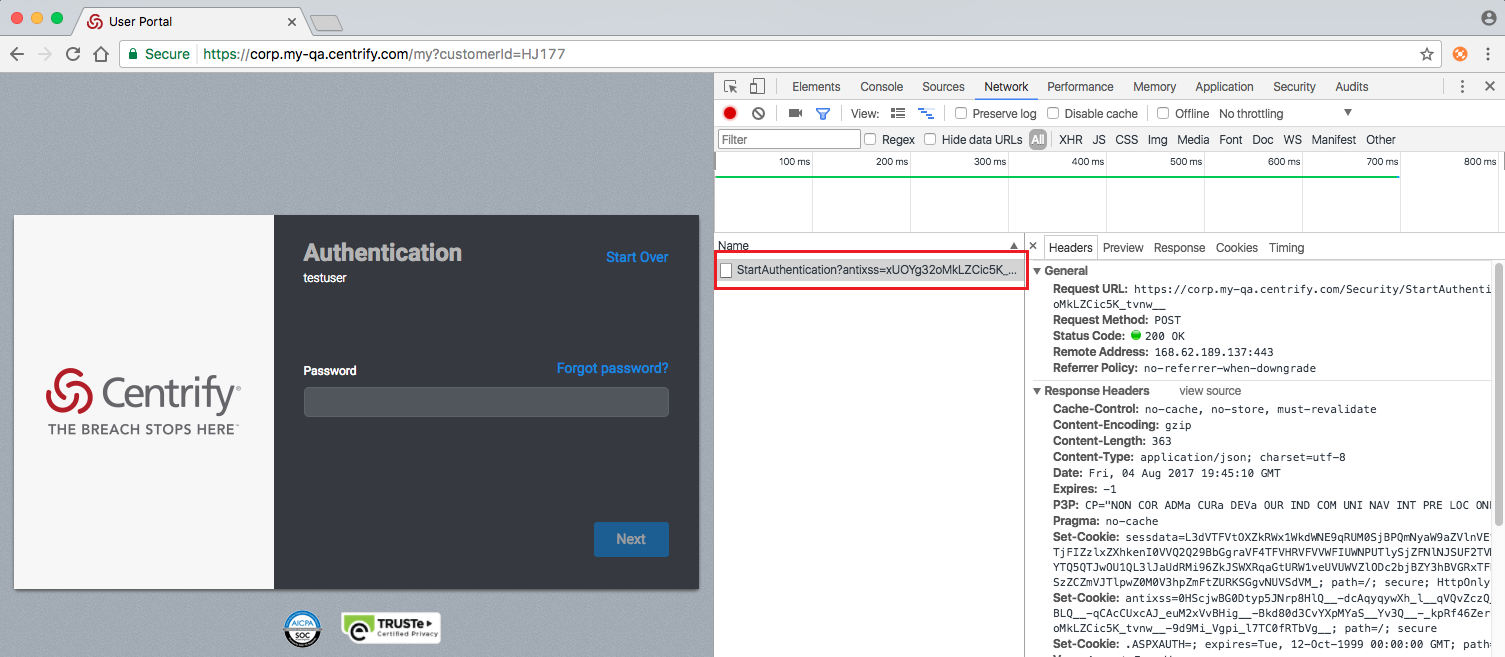
- Click the
StartAuthenticationentry and then click one of the buttons to the right (for example, Headers) to display the contents of the request.
Analyzing an Additional API Call
After you successfully authenticate the user with /Security/StartAuthentication, and /Security/AdvanceAuthentication, you have an authentication token that you can use to invoke other endpoints of the Centrify REST API.
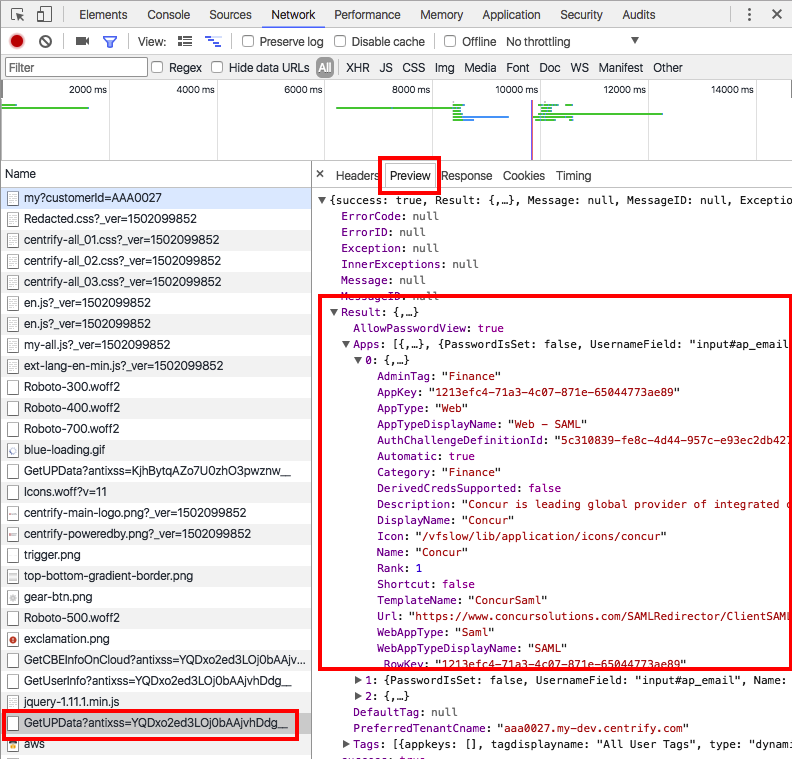
The example used in this article includes authentication of your cloud tenant which automatically redirects the user to a list of the user’s applications. The /uprest/GetUPData endpoint was automatically invoked to obtain this list. Therefore, the network event list not only shows the response from /Security/AdvanceAuthentication but also that of the /uprest/GetUPData endpoint and other communications between the client and server.
To analyze /Security/AdvanceAuthentication in the Chrome developer toolset, click the AdvanceAuthentication entry and then click one of the buttons to the right (for example, Headers) to display the contents of the request and response.
To analyze /uprest/GetUPData in the Chrome developer toolset, click the GetUPData entry and then click one of the buttons to the right (for example, Preview) to display the contents of the response.
Updated 7 months ago
